Inventory Quality
Last updated: August 19, 2026
The Inventory Quality Dashboard gives you a real-time, impression-level view of ad inventory health across your entire portfolio. It is organized into four tabs — Overview, Top Offenders, By Metric, and Domain Report — each designed for a different level of analysis, from portfolio-wide health to individual page and placement issues.
Gamera measures every impression that renders on your pages. This is different from crawler-based approaches, which periodically load pages and infer quality from page structure. Gamera captures actual user sessions — scroll depth, refresh timing, viewport occupancy — so the data reflects real conditions, not a synthetic snapshot.
How to Use This Dashboard
The Inventory Quality Dashboard works across four levels of detail — portfolio, domain, metric, and placement. The tabs are designed to be used in sequence: start broad in the Overview to understand your overall health, narrow to a problem area in Top Offenders or By Metric, then go deep in the Domain Report and the on-page Diagnostic tool to understand root cause.
The five steps below cover the highest-value actions you can take right away. Each links to the relevant section of this guide.
1: Start with the Overview tab
Check your portfolio quality score and the six metric cards at the bottom. Any card showing flagged issues is your starting point — click "View details" to go straight to the drilldown for that category. Cards showing "All clear" can be deprioritized.
2: Use Top Offenders to prioritize by domain
If you manage multiple domains, the Top Offenders tab tells you which sites to investigate first. Look at the score alongside impression volume — a penalty on a high-volume domain has more revenue impact than the same penalty on a low-traffic one. The flagged metric pills on each row tell you immediately which categories are driving the score down.
3: Use By Metric to find the specific pages and placements causing issues.
Select the flagged metric and expand the relevant domain to see a ranked list of pages by impression volume. Sort by volume to prioritize fixes by revenue impact. The worst-performing metric value for each page is highlighted in orange. This is also where you launch the on-page Diagnostic tool — click Visit next to any page URL to inspect its ad slots live.
4: Use the Domain Report for a full single-domain picture.
The Domain Report shows site-wide metric averages alongside per-issue tables broken down by page and placement. Use it when you want to share a quality snapshot with a specific publisher, or when you need to understand whether an issue is page-specific or structural across the whole domain. Use the data period toggle to compare recent vs. historical performance.
5: Use the Diagnostic tool to understand root cause.
When you know which page has an issue, open it with the Diagnostic overlay active. Check the Issues tab for a summary of what's been flagged, then select the specific placement in the Placements list and review its Event History. The render sequence — when events fired relative to each other — is usually where the root cause becomes visible.
Overview Tab
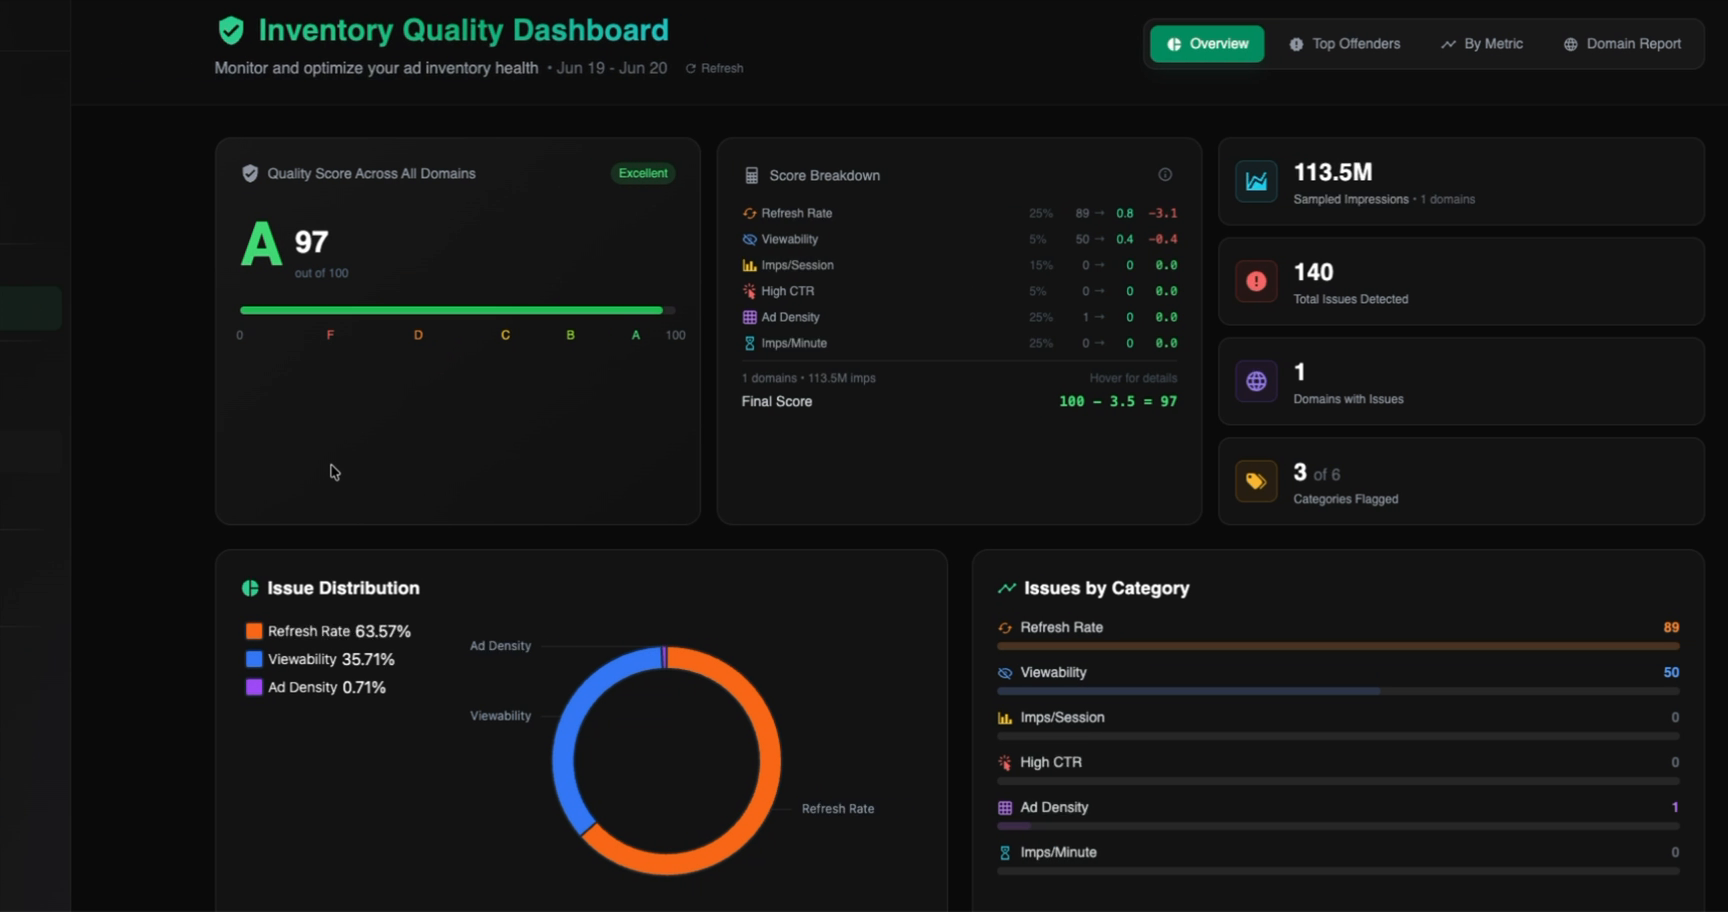
The Overview tab is your starting point. It shows the health of your full portfolio at a glance, with a quality score, score breakdown, issue summary, and per-metric status cards.
Quality Score
The large grade letter and score (e.g., A 97/100 — Excellent) represent the weighted quality score across all instrumented domains for the previous 24 hours. The score starts at 100 and decreases based on issues found, using dual normalization to keep scoring fair regardless of portfolio size or impression volume.
Score Breakdown
The Score Breakdown panel shows exactly how the final score was calculated. For each metric category it displays:
The category's weight in the overall score (e.g., Refresh Rate 25%, Viewability 5%)
The number of flagged issues
The weighted issue rate
The penalty applied to the final score
Hovering over a row reveals additional detail on how that category's penalty was calculated.
Dual Normalization
A domain with 10,000 placements naturally generates more issues than one with 10 placements. To keep scoring fair across portfolios of different sizes, each category is normalized two ways, and the more favorable (lower) value is used:
· By Domains — issues per 10 domains
· By Impressions — issues per 1M impressions
This means high-traffic sites get credit for impression volume, large portfolios get credit for domain count, and neither is unfairly penalized for scale.
Logarithmic Scaling
Penalties within each category don't scale evenly — the first issue or two has an outsized impact on the score, while additional issues beyond that add comparatively less. In practice this means even a single flagged placement in a high-weight category can move the score meaningfully, and fixing just one or two issues there is often the fastest way to improve it.
Summary Stats (top right)
Four tiles in the top-right give a quick read on portfolio scale and issue volume:
Sampled Impressions: Total impressions measured across all domains in the period
Total Issues Detected: Count of individual flagged placements/pages across all categories
Domains with Issues: Number of domains where at least one quality flag was raised
Categories Flagged: How many of the six metric categories have active issues (e.g., 3 of 6)
Issue Distribution & Issues by Category
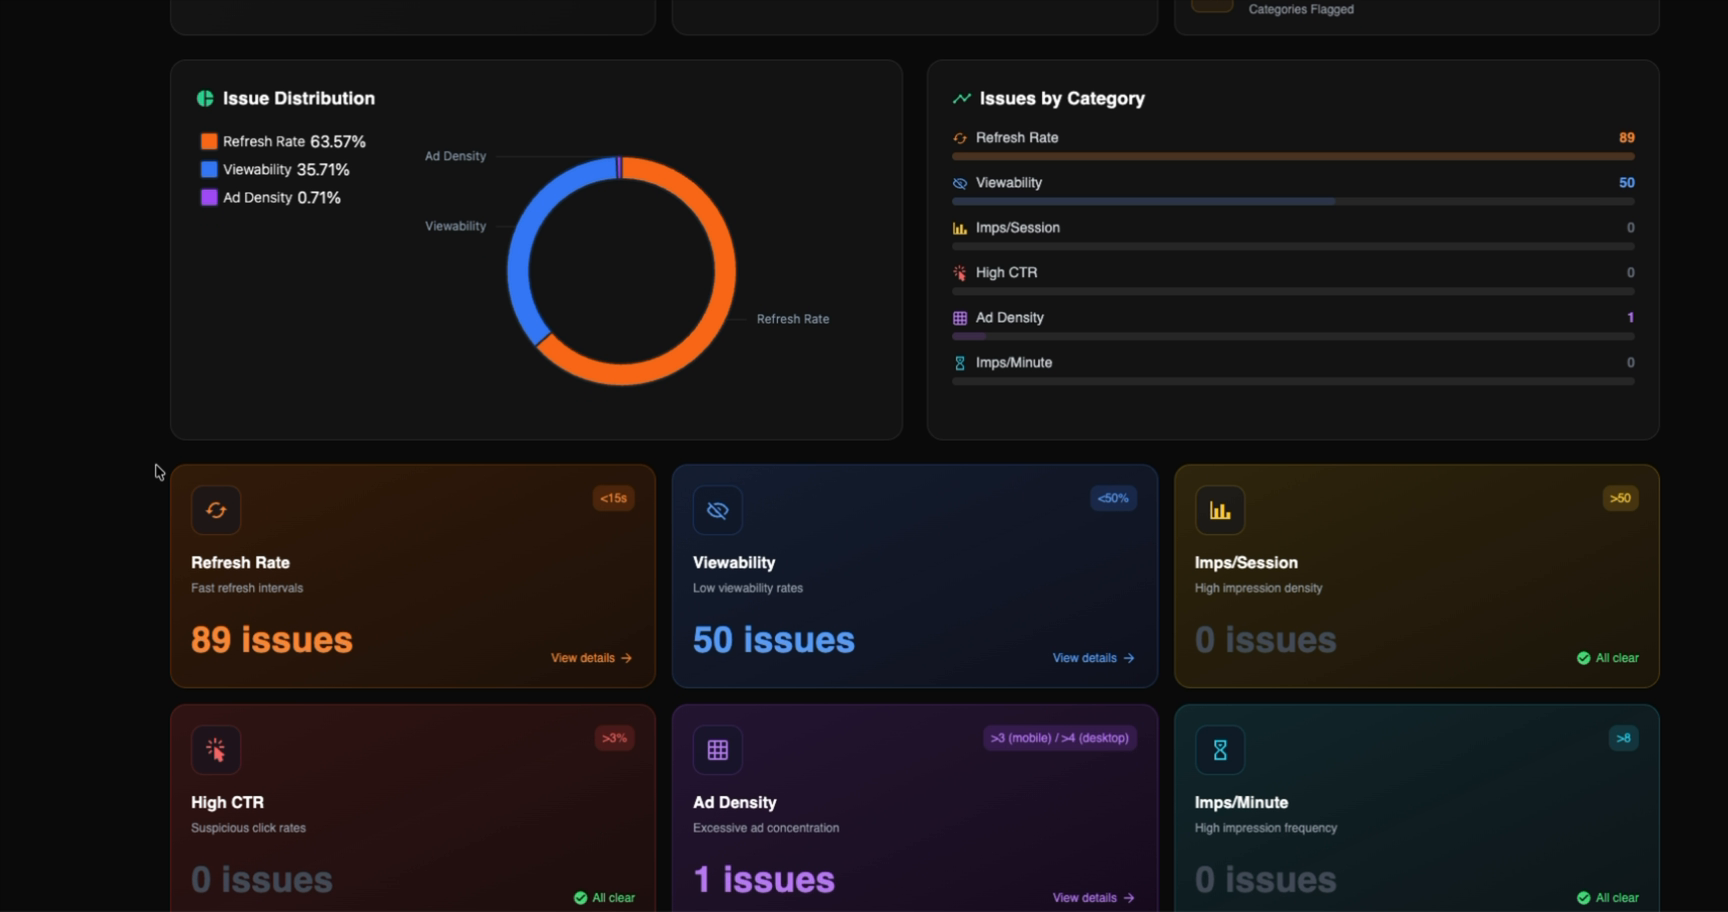
The lower half of the Overview tab contains two summary panels:
Issue Distribution: A donut chart showing what proportion of total issues belong to each metric category
Issues by Category: A horizontal bar chart of raw issue counts per category, making it easy to see which categories are driving the most flagged impressions
Below those panels, six metric cards summarize the status of each category. Cards with active issues show the issue count and a "View details →" link. Cards with no issues show "All clear" in green.
Use the metric cards as your first triage step. Click "View details" on any flagged category to jump directly into the By Metric drilldown.
Top Offenders Tab
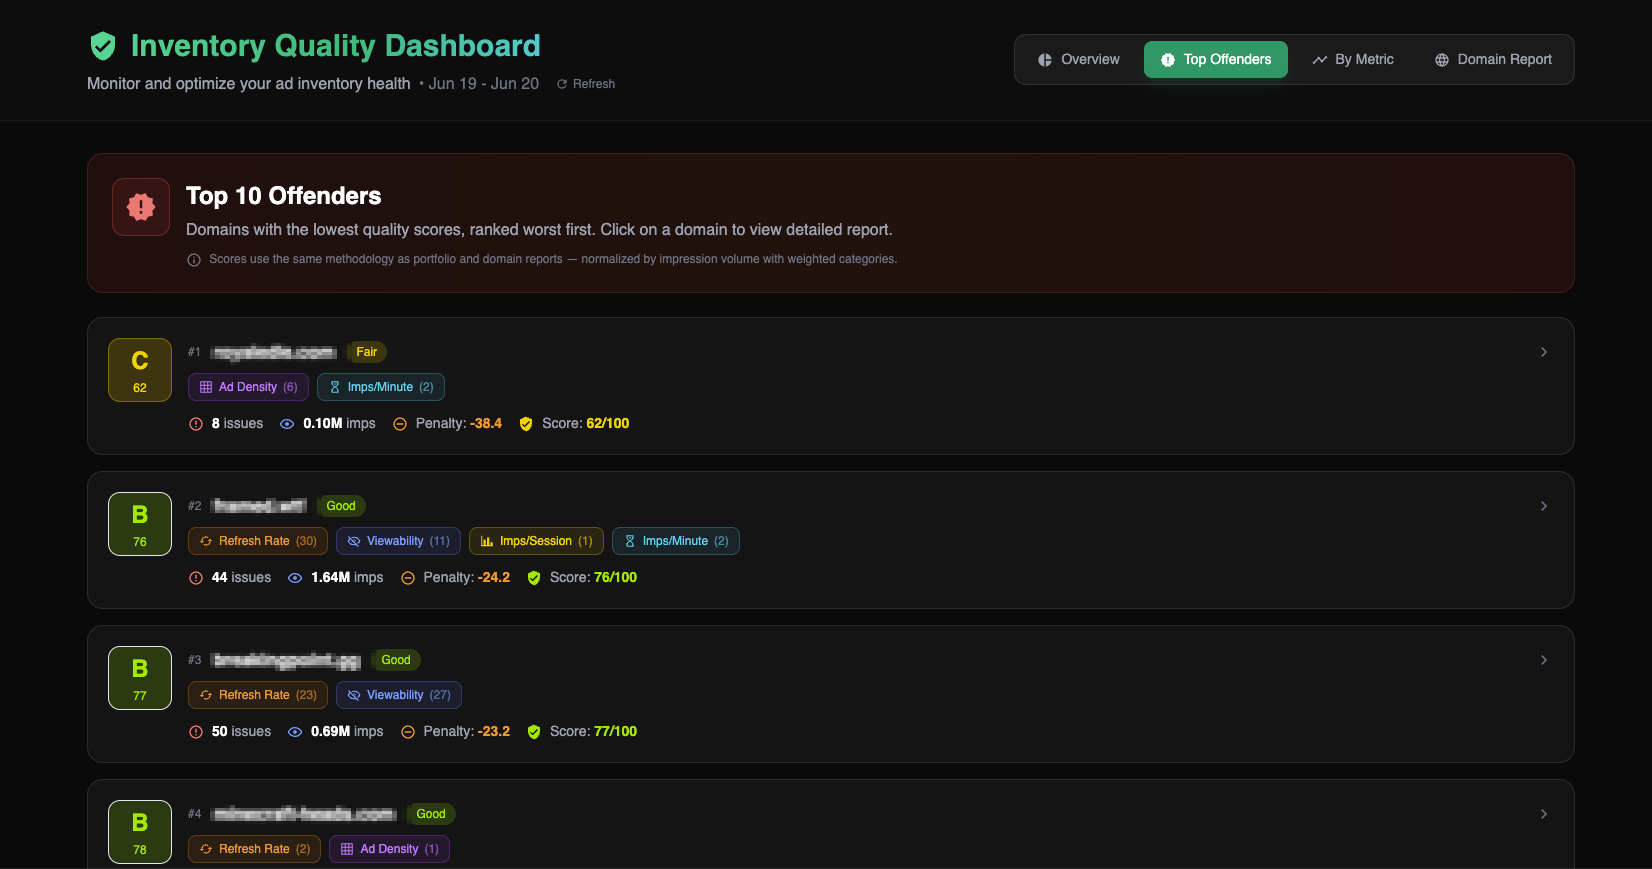
The Top Offenders tab ranks domains in your portfolio by quality score, worst first. Use it to quickly identify which sites need attention without having to check each domain individually.
Reading the List
Each row represents one domain and displays:
Grade letter and numeric score: using the same scoring methodology as the Overview tab
Overall quality label: Fair, Good, Excellent, etc.
Flagged metric pills: Colored tags showing which categories have issues and the count within each (e.g., Ad Density (6), Imps/Minute (2), Refresh Rate (30))
Issue count: Total number of flagged issues across all categories for that domain
Impression volume: How many impressions presented with issues
Penalty: The total score deduction applied to that domain
Score: The final quality score for that domain
Click anywhere on a domain row to open its full Domain Report.
By Metric Tab
The By Metric tab lets you isolate a single quality metric and see every domain, page, and placement flagged for that issue across your portfolio. Use it when you want to investigate a specific problem type — for example, finding all placements with low viewability or all pages with aggressive refresh intervals.
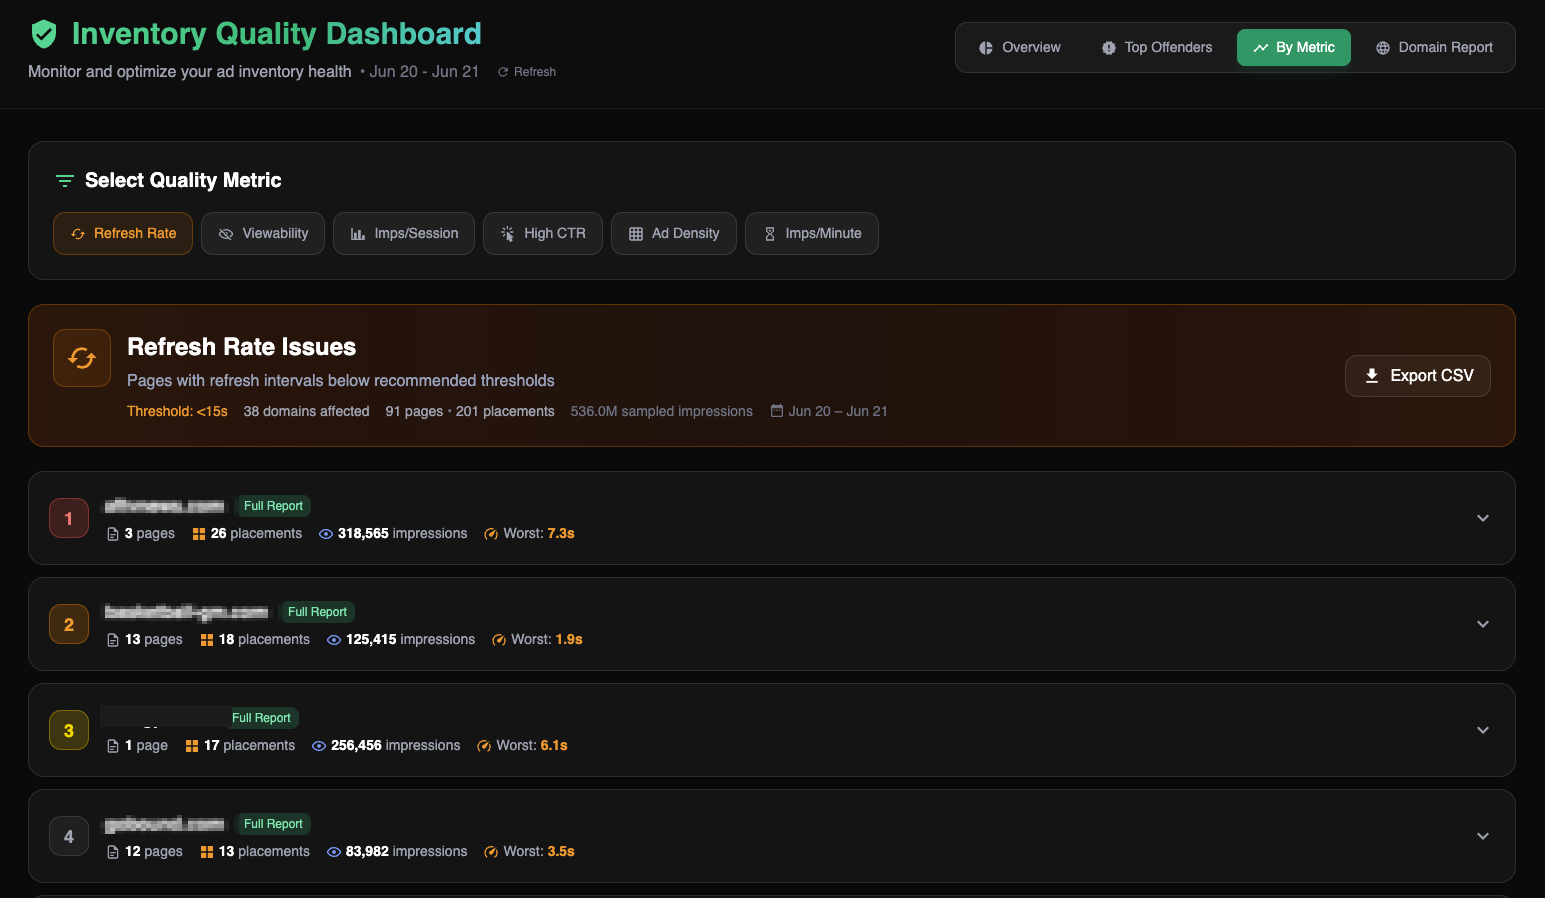
Results are grouped by domain. Each domain row shows the domain name, a Full Report link, and summary counts for pages affected, placements affected, total impressions, and the worst single metric value observed. Click the chevron (or anywhere on the row) to expand it and see the full breakdown by page.
When expanded, each row in the table shows the page URL path, device type (mobile or desktop), number of placements flagged on that page with the relevant issue, the average metric value for that page, impression volume, and a Visit button in the Actions column. Clicking Visit opens that page in a new tab with the Gamera Ad Health Diagnostics overlay active — so you can inspect the flagged placements live. See Gamera Ad Health Diagnostics at the end of this guide for full details.
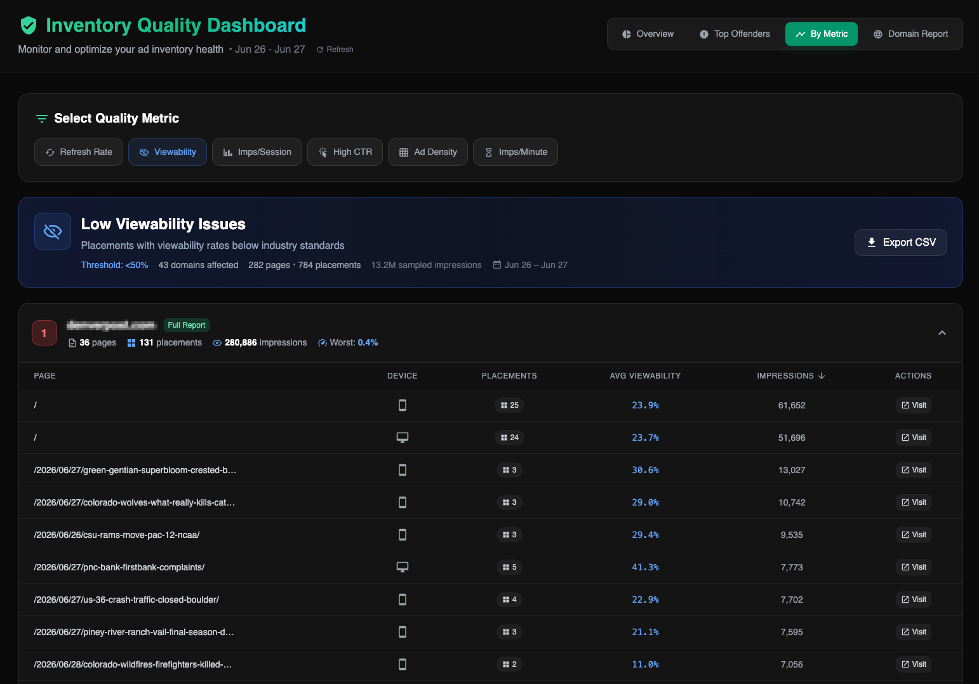
Use the Export CSV button in the top-right of the results panel to download the full placement-level breakdown for the selected metric.
A note on Refresh Rate flags
Refresh Rate is the most commonly flagged metric and also the most frequently misread. Not every refresh rate flag indicates a problem you need to act on immediately. When refresh issues do warrant investigation, look at the specific page paths and device types in the By Metric results. Refresh problems are usually concentrated on specific page templates (e.g., gallery pages, infinite scroll) or device types, not site-wide.
Imps/Session and Imps/Minute measure related but different things. A high Imps/Session on a site with long average session durations (gaming sites, tools, reference content) is expected and may not indicate a quality problem. Imps/Minute is the tighter signal — it controls for session length and is the metric that factors most heavily into scoring.
Domain Report Tab
The Domain Report tab provides a full quality breakdown for a single domain. Use it to investigate a specific site in depth — understanding its site-wide metric averages, which pages and placements are driving issues, and how issues break down by category.
Selecting a Domain
The domain picker at the top of the tab lists all instrumented domains in a grid. Each domain tile shows a status indicator:
Green checkmark: No quality issues detected in the selected period
Orange dot: One or more quality issues detected
Use the search box to find a domain by name, or scroll and click any tile to load its report. The selected domain is highlighted in green.
NOTE: Newly added domains can take up to 24 hours to appear in the Domain Report
Quality Report Header
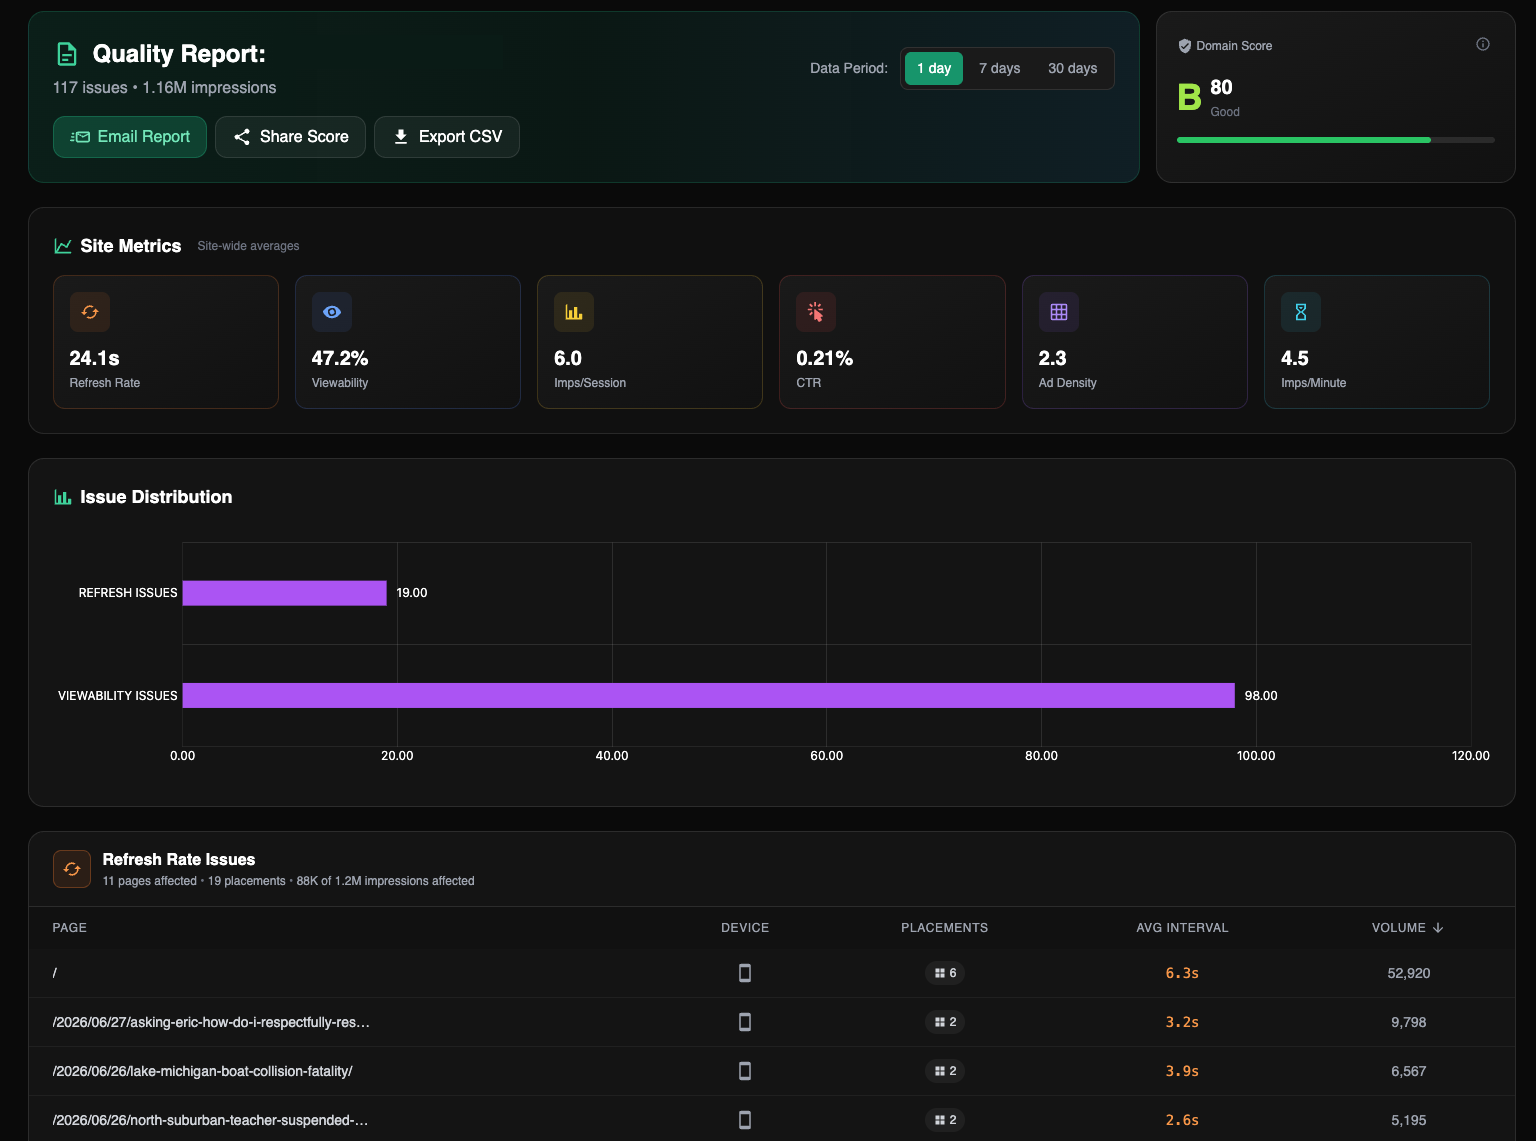
Once a domain is selected, the Quality Report loads below the picker. The header shows:
Domain name, total issue count, and total impression volume for the period
Data Period — Toggle between 1 day, 7 days, and 30 days to change the reporting window
Domain Score — The same letter grade and numeric score used across all tabs, with a grade bar
Three action buttons are available:
Email Report: Sends the domain quality report to a specified recipient
Share Score: Generates a shareable link to this domain's report
Export CSV: Downloads the full placement-level data for this domain
The Share Score link is useful when you want to show a specific publisher or internal stakeholder the quality snapshot for their site without giving them full platform access.
Site Metrics
The Site Metrics row provides baseline context before you look at the issue tables below. A metric that averages well overall can still have specific pages or placements dragging it down.
Issue Distribution & Per-Issue Tables
Clicking any page URL in an issue table opens that page in a new tab with the Gamera Ad Health Diagnostics overlay active. This lets you move directly from identifying a flagged page in the report to inspecting its ad placements live. See Gamera Ad Health Diagnostics at the end of this guide for full details.
The metric value shown in each row is the average for that page/placement combination — not the worst single impression. Sort by volume to prioritize fixes by revenue impact.
Categories with no issues are not shown. If a domain is fully clean, the report displays Site Metrics only with no issue tables below.
Gamera Ad Health Diagnostics
The Gamera Ad Health Diagnostics tool is an on-page overlay that lets you inspect ad placements in real time, directly on a live publisher page. It is accessible from within the Inventory Quality dashboard: clicking the Visit link next to a page URL in the By Metric tab, or clicking a page URL in a Domain Report issue table, opens that page in a new tab with the diagnostic overlay already loaded.
The tool is also accessible directly by appending ?gameraDiagnostics to any URL on an instrumented site.
The overlay panel includes the following tabs:
Placements: Lists every ad slot detected on the current page, numbered sequentially. Each row shows the placement ID (e.g., div-1-gpt), the AU Path (the full GAM ad unit path), and the current render count. Clicking a placement in this list selects it and loads its data in the Details tab.
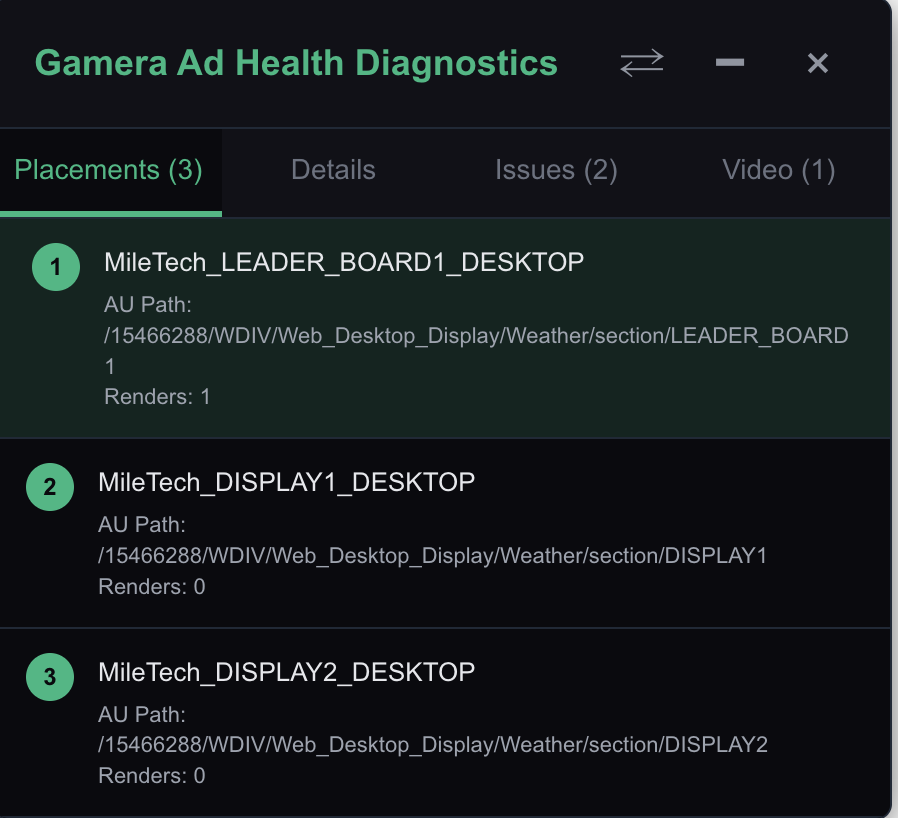
Slots with 0 renders have been detected on the page but have not fired yet — this typically means they are below the fold, configured for lazy loading, or not rendering in the current session.
Details: Shows full performance data for the selected placement. The Details tab includes:
Placement: Div ID, Universal ID, and AU Path — the identifiers Gamera uses to track this slot across sessions.
Performance: Renders (in the current session), Avg Attention Time, and four historic metrics — Avg Fill Rate, Avg Viewable Rate, Avg Click Through Rate, and Median Attention Time. These historic figures reflect aggregated data from previous sessions, not just the current page load.
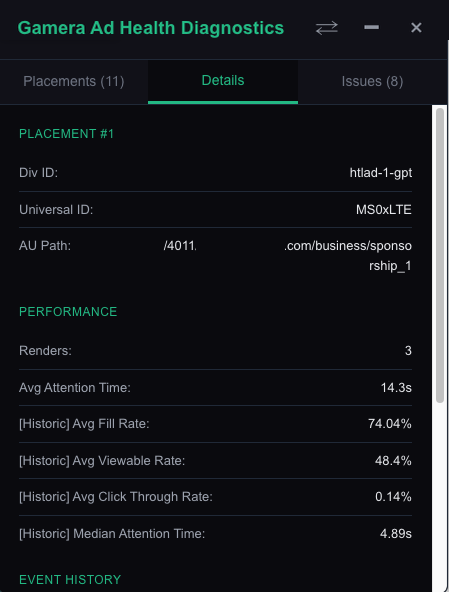
Event History: Below the performance data, an Event History log shows a timestamped sequence of ad events fired on this placement during the current session. Each entry shows the time the event ocurree and the event type. The main event types you'll see are ad Placement Gtag Rendered, ad Placement Pbjs Rendered, and Placement Viewable.
The sequence of these events is where the diagnostic value lives. A healthy placement shows a Gtag or Pbjs render followed by a Viewable event at a reasonable interval. Problematic patterns to look for:
Render before Viewable: A render event fires again before a Viewable event has been logged — the ad was refreshed before it had a chance to enter the viewport. This is one of the most common causes of low viewability scores and fast refresh flags.
Stacked renders: Multiple render events in quick succession with very short intervals between them — a typical signature of a lazy loading debounce issue or a third-party tag triggering the render function as part of its own initialization.
Repeated renders with no Viewable: A render event fires, no Viewable event follows, and then another render fires — the ad is repeatedly refreshing through impressions that never become viewable, inflating impression counts with no quality signal.
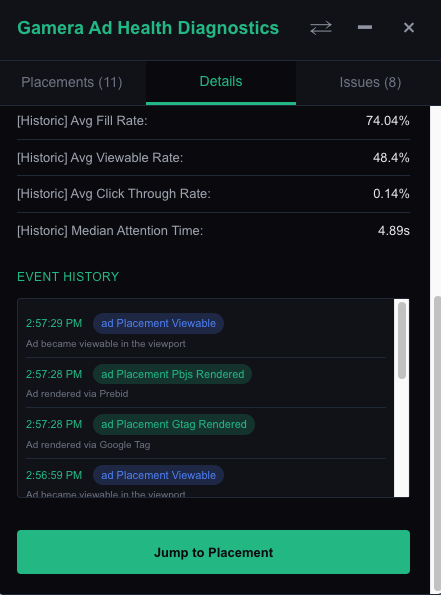
The Jump to Placement button at the bottom of the panel scrolls the page directly to the physical position of the selected ad slot.
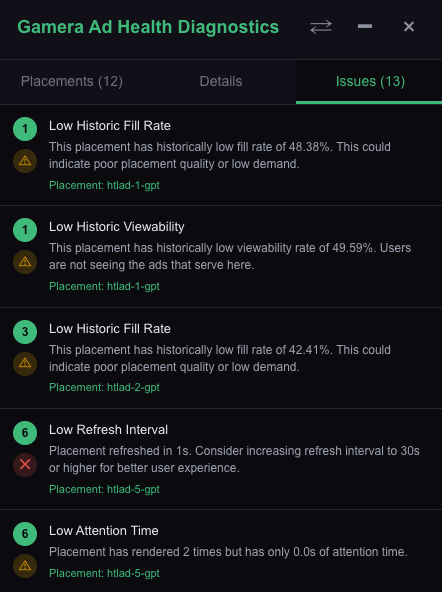
Issues: Lists all quality issues detected on the current page during this session. Each issue shows the issue type, a plain-language description of what was detected and what to consider, and the specific placement name it applies to. Issues are color-coded by severity. Each flagged placement is numbered and linked to its entry in the Placements list. The Issues tab count in the tab header updates in real time as the page loads and ads render.
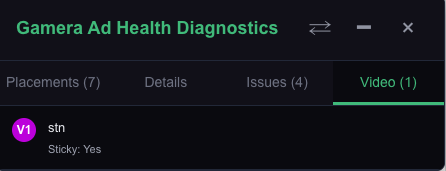
Video: the Video tab appears when Gamera detects one or more video ad placements on the current page. Each entry shows the placement name and whether the unit is sticky (i.e., remains fixed in the viewport as the user scrolls).
Use this tab to confirm that video placements are being correctly detected and to check their configuration at a glance. A video placement with Sticky: Yes will accumulate viewability and attention time differently from a standard in-content unit, which is useful context when interpreting that placement's metrics in the Details tab or in the main dashboard
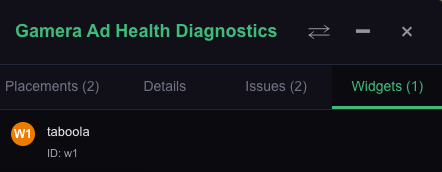
Widgets: the Widgets tab appears when Gamera detects one or more native content widgets on the current page.
How to Use It for Troubleshooting
The diagnostic tool is most useful when you have already identified a flagged page in the dashboard and want to understand the root cause before making a change.
1. Start in the dashboard. Use the By Metric or Domain Report tab to identify a specific page with a quality issue.
2. Open the page with the overlay. Numbered badges will appear on the page at each ad slot position.
3. Check the Issues tab first. This gives you the fastest summary of what Gamera has flagged on this page load, with the specific placement named.
4. Select the flagged placement in the Placements tab. Switch to Details and check the render count and Event History. Look for renders firing in rapid succession, or renders happening before a Viewable event.
5. Use the Jump to Placement button to locate the slot physically on the page. Assess its position, what surrounds it, and whether its placement in the layout explains the issue.
Focus on placements with meaningful impression volume first. A fast refresh on a slot serving 8,000 impressions a day has more revenue and quality impact than the same issue on a slot serving 200.